Many maps display data such as demographic information, territories served, or distribution of data points.
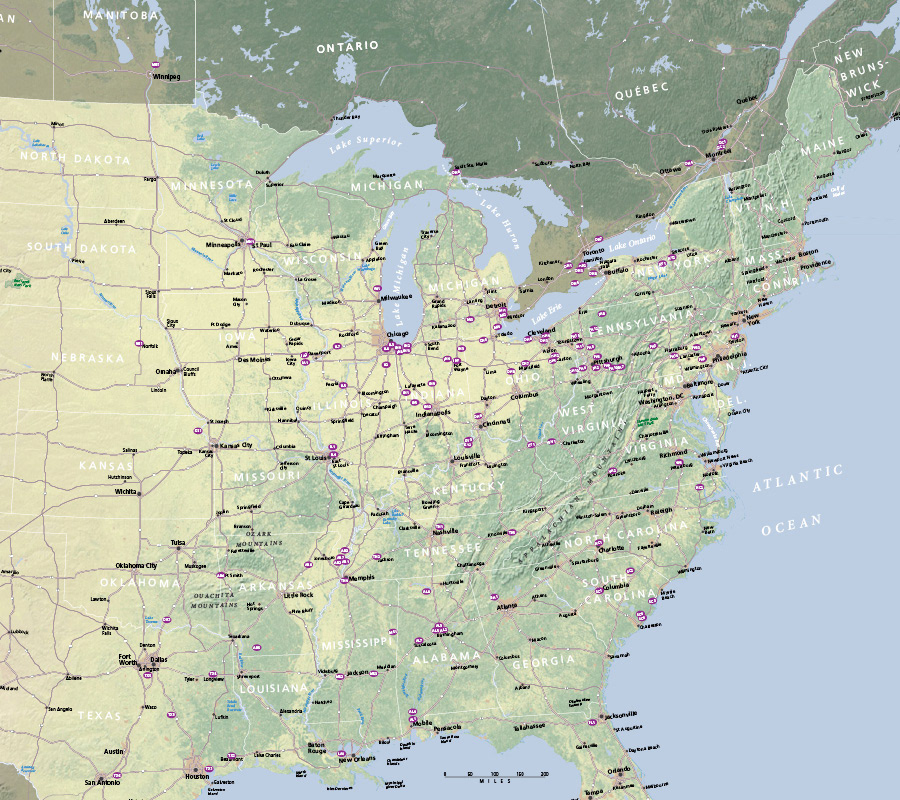
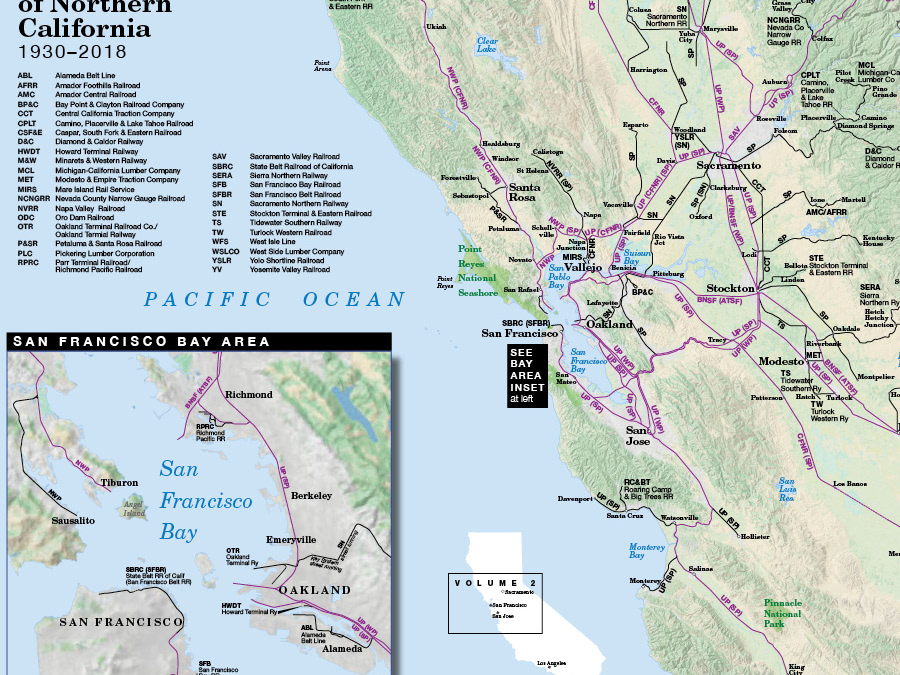
A natural-color view makes an attractive background for a poster-size map of metal producers.
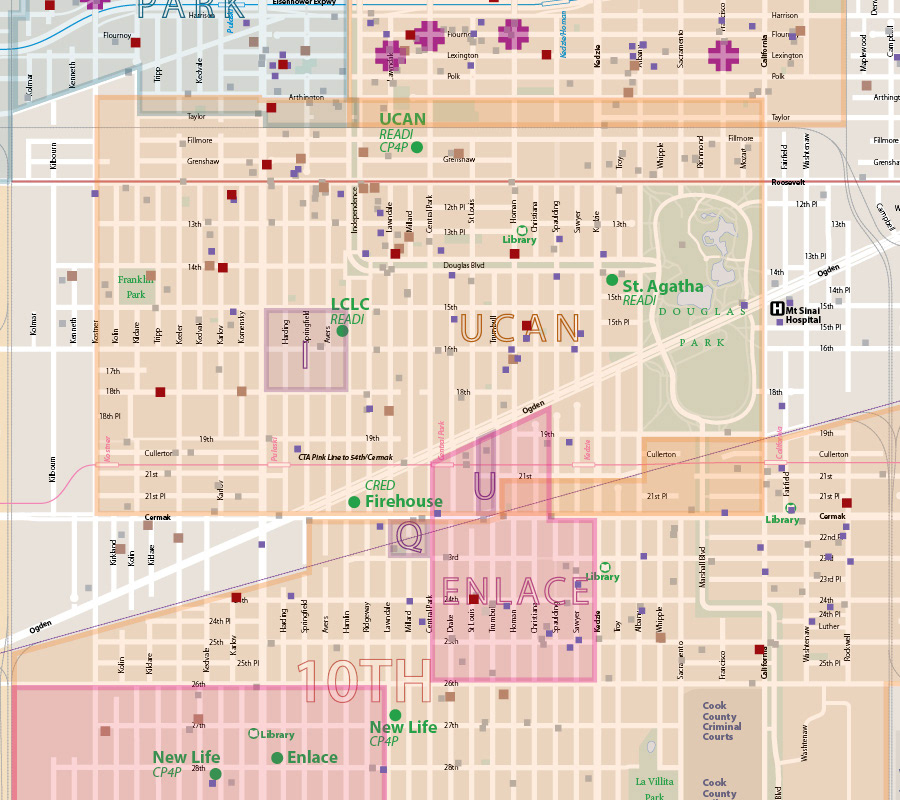
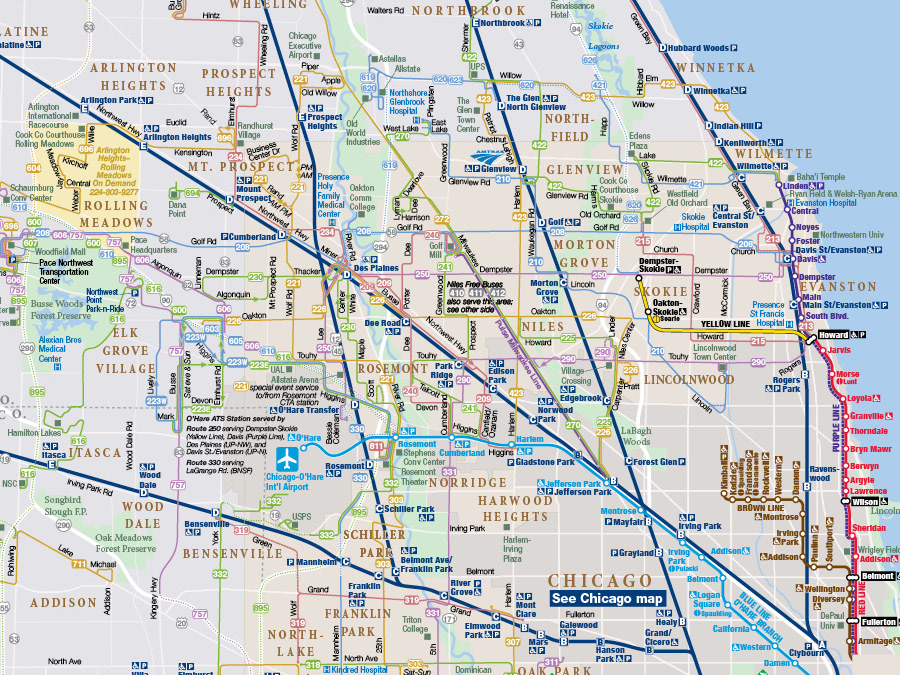
We map the locations of Chicago’s tragic shootings to assist those working to lessen the violence.
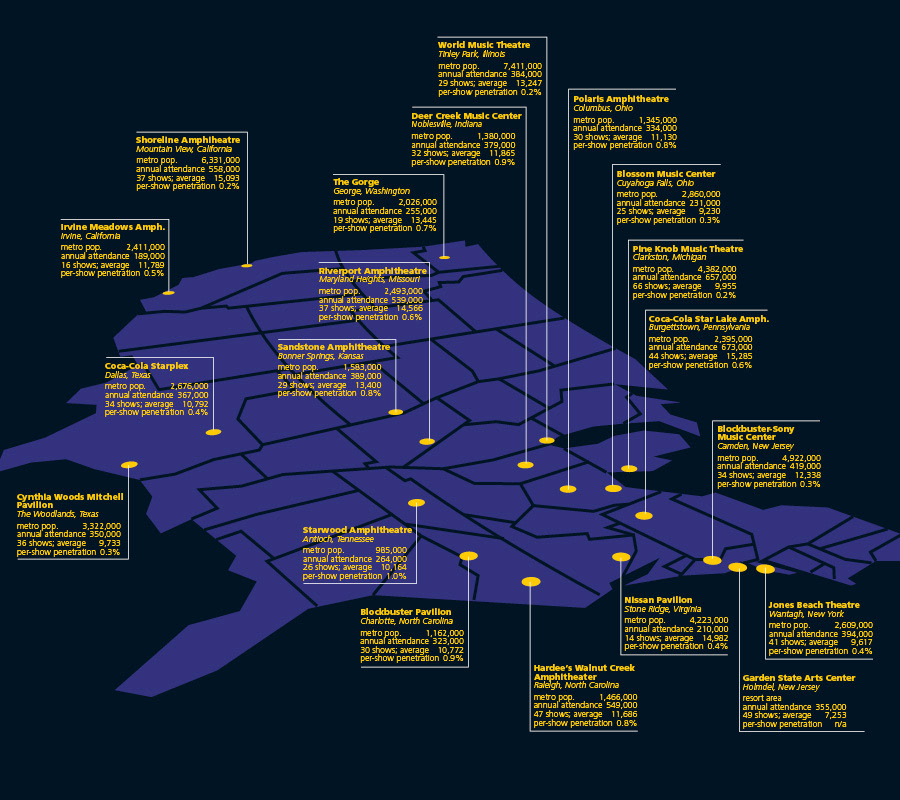
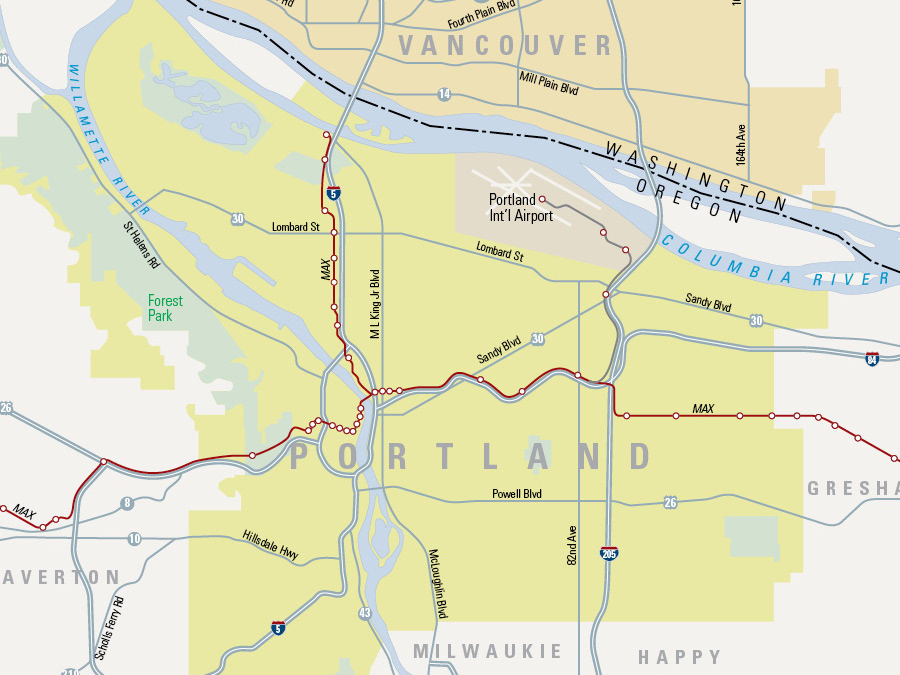
Putting the East Coast in the foreground made it easier to show the nation’s large outdoor amphitheaters.
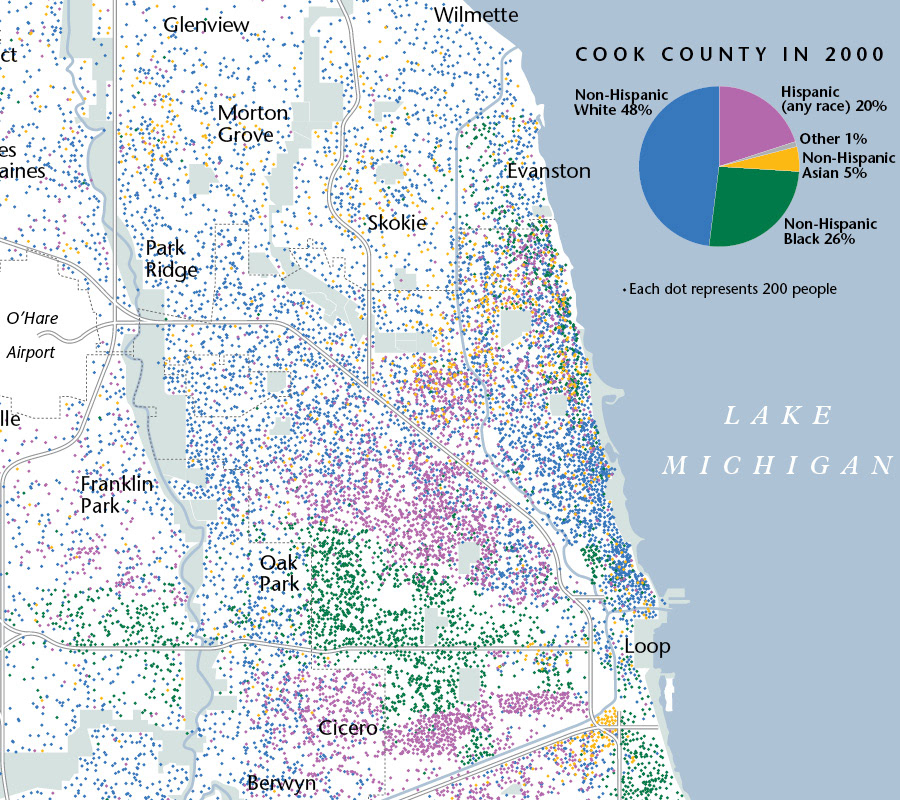
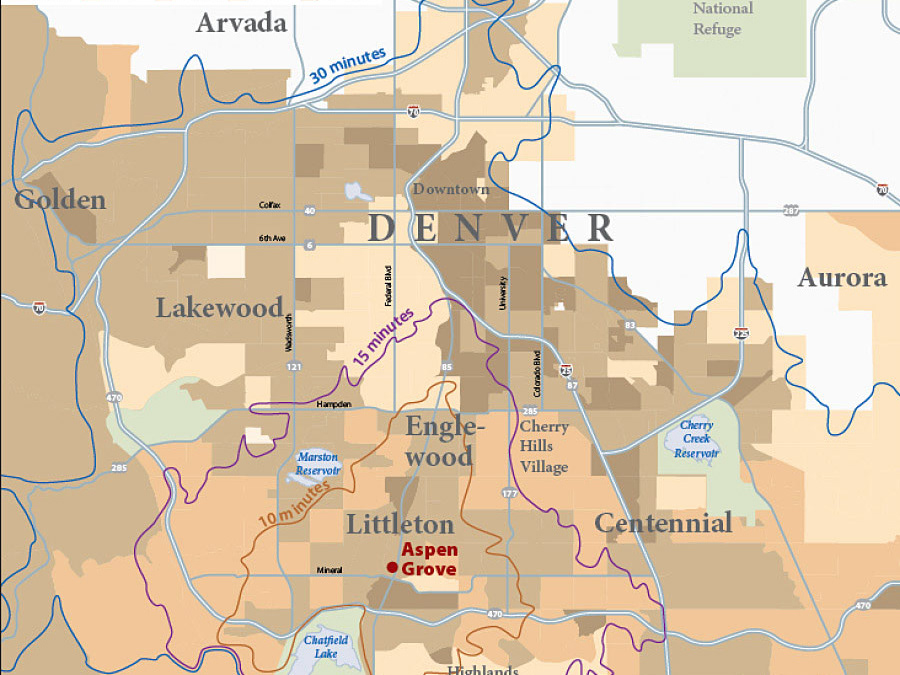
This map for the Encyclopedia of Chicago pioneered a new way to show both racial and density patterns.
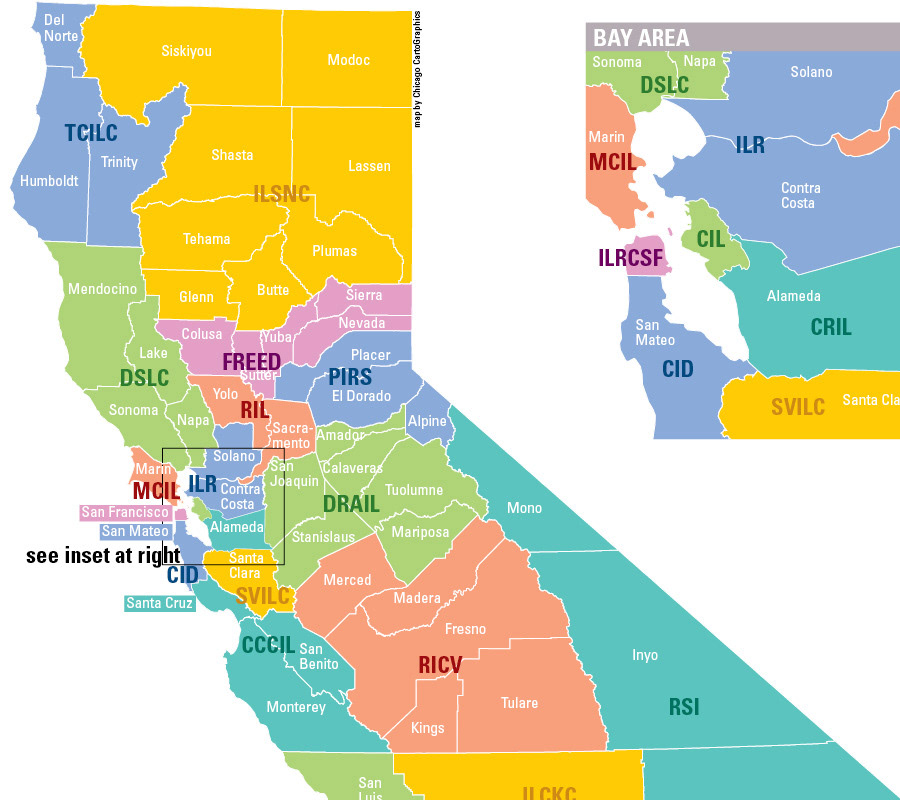
A colorful map of California shows which counties are served by local social-service providers.